
Internal Tools & Dashboards
Internal dashboards and tools that connect directly to your pipelines and warehouses, so your team sees the current state of the data — not a nightly export or a stale spreadsheet.
TYPICAL CLIENT
An ops or platform lead whose team checks five systems to answer one question
Usually an Operations Lead or Platform Manager whose team relies on manual CSV exports, Slack check-ins or spreadsheets to know what’s happening across pipelines, experiments or projects, and needs one live tool instead.
Six concrete deliverables, not a slide deck.
This is exactly what transfers to you at the end of this engagement.
Requirements & data source mapping
A documented map of every system the dashboard needs to pull from, and how each one will be queried.
Deployed internal dashboard application
A live, internal-facing application on infrastructure you control.
Role-based access configuration
Access configured so each team sees exactly what it needs, and nothing it shouldn’t.
Live or scheduled data sync
Data pulled directly from source systems on a cadence that matches how fast your data actually changes.
Documentation for extending the dashboard
Clear documentation so your team can add a new view or metric without coming back to us for every change.
Source code & infrastructure-as-code
Full repository access plus infrastructure configs, transferred outright.
What this service includes
Dashboard & internal tool design
Interfaces designed around the actual questions your team asks every week, not a generic BI template.
Live pipeline & warehouse integration
Direct connections into your pipelines and data warehouse, so the dashboard never shows stale numbers.
Role-based access control
Permissions configured to match your team structure, so sensitive data stays visible only to the right people.
Ongoing extension & maintenance
A codebase built to be extended by your own team, or by us on retainer, as new questions come up.
What this looks like in a real engagement
Three concrete examples of the kind of work this service covers.
Pipeline run-status dashboard
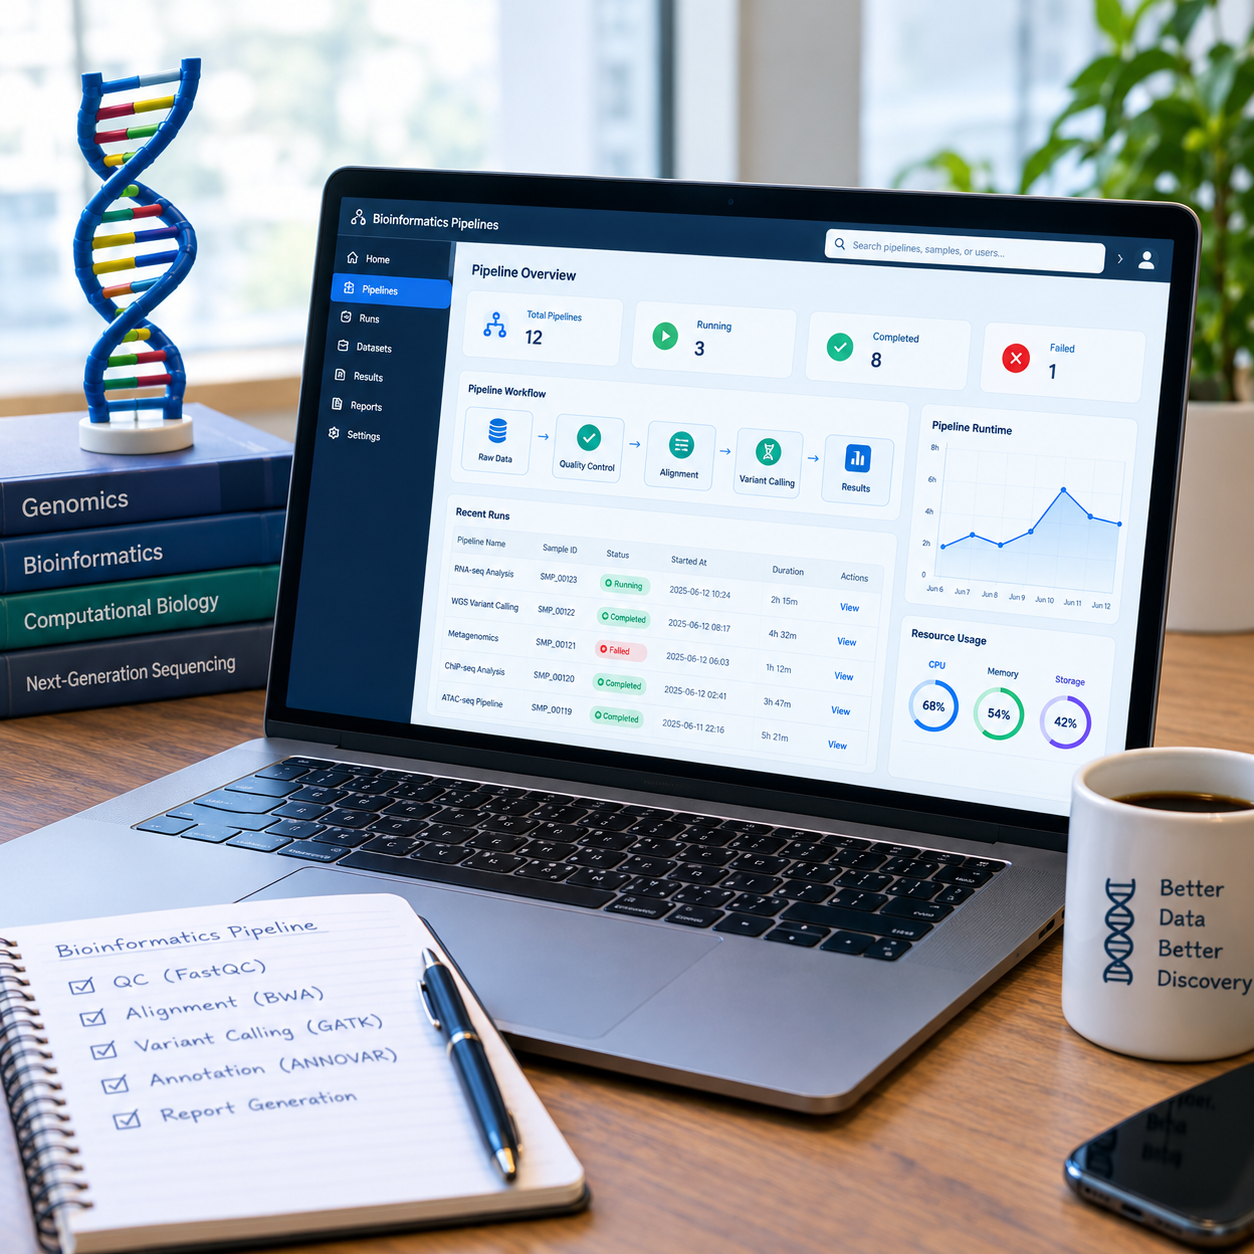
A live view of every pipeline run, replacing a daily round of Slack messages asking whether a job finished.
Experiment tracking dashboard across multiple labs
A shared internal tool giving leadership visibility into experiment status across teams that previously tracked everything separately.
Executive metrics dashboard from several systems
A single dashboard pulling numbers from three internal systems that previously required a manual weekly report to reconcile.
Why internal tools stop scaling once spreadsheets are the source of truth.
Every team starts with a spreadsheet. It works until three people are editing it, someone’s numbers are a day old, and nobody fully trusts what they’re looking at. At that point, an internal tool isn’t a nice-to-have — it’s the only way to keep a single source of truth.
We build dashboards that connect live to your actual systems, so the number your team sees is the number that’s true right now, not the number from last night’s export.
How an engagement runs
Four stages, from initial scope to delivery.
Map the data sources
We identify every system the dashboard needs to pull from and how each connects.
Design the dashboard
Views are designed around the specific questions your team actually needs answered.
Build & connect live
The dashboard is built and wired directly into your pipelines and warehouse.
Deploy & train the team
The tool is deployed and your team is walked through how to use and extend it.
What we build it with
We stopped asking engineering for one-off reports the week this shipped.
Before you reach out
Yes. Most internal dashboards we build combine two or more systems — pipelines, warehouses and third-party tools — into one coherent view.
Role-based permissions are configured during the build so each team or individual sees only what their role should allow.
The codebase and documentation are built for your team to extend directly, or we can support ongoing changes through a retainer.
Explore related work
Product Engineering
Full customer-facing product builds, for when internal visibility isn’t the only need.
View APIAPI & Integration Development
The integration layer that often feeds a dashboard’s live data.
View BIOBioinformatics Pipeline
The pipelines many of our dashboards are built to monitor.
ViewStill checking five systems to answer one question?
Tell us what your team currently has to piece together manually — we’ll show you what one live dashboard looks like instead.